TensorFlow Plot

tfplot is a simple TensorFlow utility for drawing any matplotlib plots or figures into images, as a part of TensorFlow computation graph.
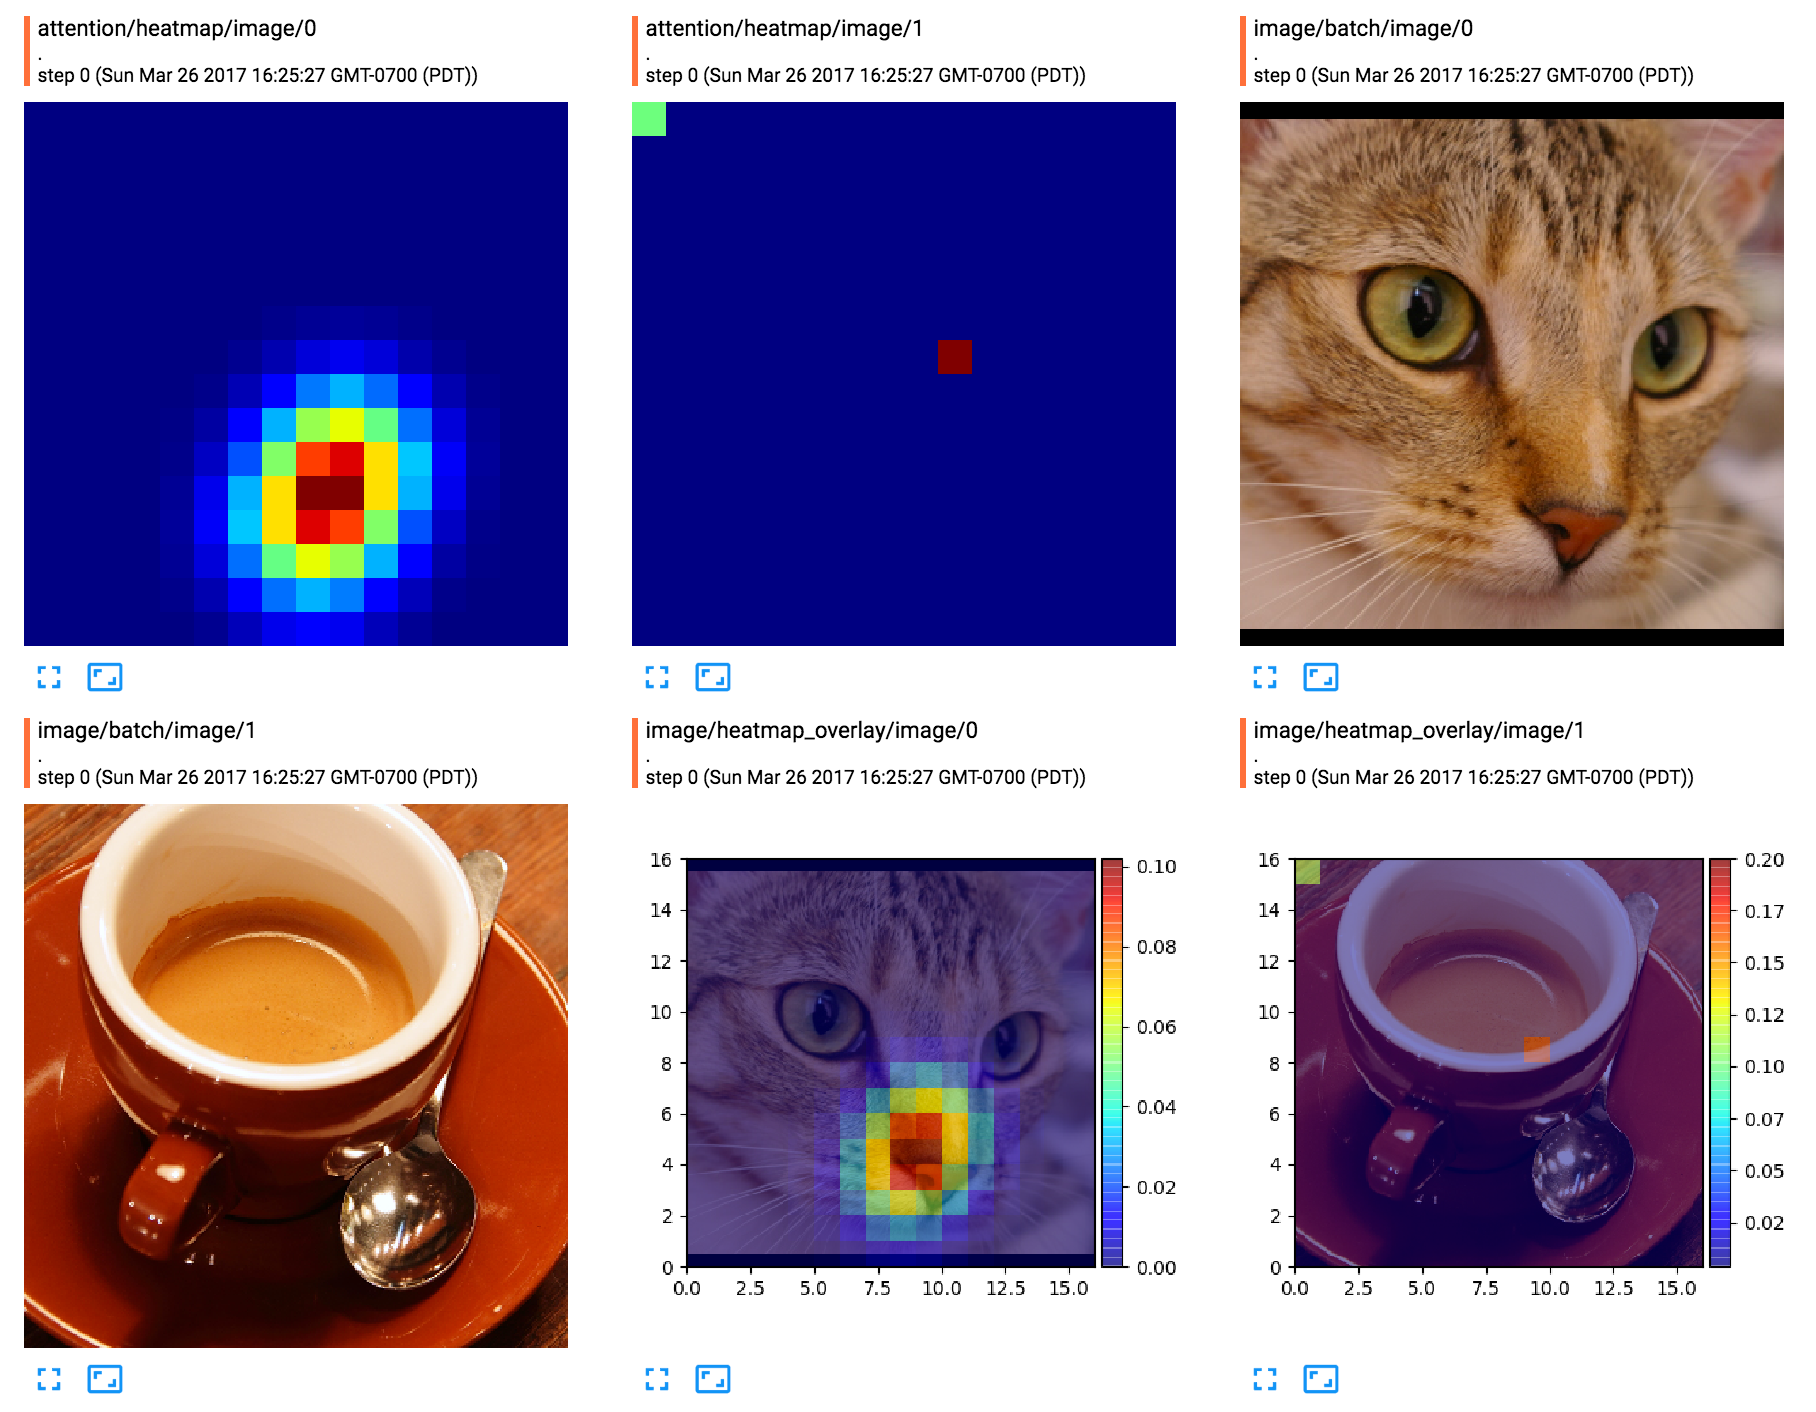
Especially, we can easily any plot and see the result image as an image summary in TensorBoard.
User Guide
Showcases of tfplot
This guide shows a quick tour of the tfplot library. Please skip the setup section of this document.
[5]:
import tfplot
tfplot.__version__
[5]:
'0.3.0.dev0'
Setup: Utilities and Data
In order to see the images generated from the plot ops, we introduce a simple utility function which takes a Tensor as an input and displays the resulting image after executing it in a TensorFlow session.
You may want to skip this section to have the showcase started.
[6]:
import tensorflow as tf
sess = tf.InteractiveSession()
[7]:
def execute_op_as_image(op):
"""
Evaluate the given `op` and return the content PNG image as `PIL.Image`.
- If op is a plot op (e.g. RGBA Tensor) the image or
a list of images will be returned
- If op is summary proto (i.e. `op` was a summary op),
the image content will be extracted from the proto object.
"""
print ("Executing: " + str(op))
ret = sess.run(op)
plt.close()
if isinstance(ret, np.ndarray):
if len(ret.shape) == 3:
# single image
return Image.fromarray(ret)
elif len(ret.shape) == 4:
return [Image.fromarray(r) for r in ret]
else:
raise ValueError("Invalid rank : %d" % len(ret.shape))
elif isinstance(ret, (str, bytes)):
from io import BytesIO
s = tf.Summary()
s.ParseFromString(ret)
ims = []
for i in range(len(s.value)):
png_string = s.value[i].image.encoded_image_string
im = Image.open(BytesIO(png_string))
ims.append(im)
plt.close()
if len(ims) == 1: return ims[0]
else: return ims
else:
raise TypeError("Unknown type: " + str(ret))
and some data:
[8]:
def fake_attention():
import scipy.ndimage
attention = np.zeros([16, 16], dtype=np.float32)
attention[(11, 8)] = 1.0
attention[(9, 9)] = 1.0
attention = scipy.ndimage.filters.gaussian_filter(attention, sigma=1.5)
return attention
sample_image = scipy.misc.face()
attention_map = fake_attention()
# display the data
fig, axs = plt.subplots(1, 2, figsize=(10, 4))
axs[0].imshow(sample_image); axs[0].set_title('image')
axs[1].imshow(attention_map, cmap='jet'); axs[1].set_title('attention')
plt.show()

And we finally wrap these numpy values into TensorFlow ops:
[9]:
# the input to plot_op
image_tensor = tf.constant(sample_image, name='image')
attention_tensor = tf.constant(attention_map, name='attention')
print(image_tensor)
print(attention_tensor)
Tensor("image:0", shape=(768, 1024, 3), dtype=uint8)
Tensor("attention:0", shape=(16, 16), dtype=float32)
1. tfplot.autowrap: The Main End-User API
Use tfplot.autowrap to design a custom plot function of your own.
Decorator to define a TF op that draws plot
With tfplot.autowrap, you can wrap a python function that returns matplotlib.Figure (or AxesSubPlot) into TensorFlow ops, similar as in tf.py_func.
[10]:
@tfplot.autowrap
def plot_scatter(x, y):
# NEVER use plt.XXX, or matplotlib.pyplot.
# Use tfplot.subplots() instead of plt.subplots() to avoid thread-safety issues.
fig, ax = tfplot.subplots(figsize=(3, 3))
ax.scatter(x, y, color='green')
return fig
x = tf.constant(np.arange(10), dtype=tf.float32)
y = tf.constant(np.arange(10) ** 2, dtype=tf.float32)
execute_op_as_image(plot_scatter(x, y))
Executing: Tensor("plot_scatter:0", shape=(?, ?, 4), dtype=uint8)
[10]:

We can create subplots as well. Also, note that additional arguments (i.e. kwargs) other than Tensor arguments (i.e. positional arguments) can be passed.
[11]:
@tfplot.autowrap
def plot_image_and_attention(im, att, cmap=None):
fig, axes = tfplot.subplots(1, 2, figsize=(7, 4))
fig.suptitle('Image and Heatmap')
axes[0].imshow(im)
axes[1].imshow(att, cmap=cmap)
return fig
op = plot_image_and_attention(sample_image, attention_map, cmap='jet')
execute_op_as_image(op)
Executing: Tensor("plot_image_and_attention:0", shape=(?, ?, 4), dtype=uint8)
[11]:

Sometimes, it can be cumbersome to create instances of fig and ax. If you want to have them automatically created and injected, use a keyword argument named fig and/or ax:
[12]:
@tfplot.autowrap(figsize=(2, 2))
def plot_scatter(x, y, *, ax, color='red'):
ax.set_title('x^2')
ax.scatter(x, y, color=color)
x = tf.constant(np.arange(10), dtype=tf.float32)
y = tf.constant(np.arange(10) ** 2, dtype=tf.float32)
execute_op_as_image(plot_scatter(x, y))
Executing: Tensor("plot_scatter_1:0", shape=(?, ?, 4), dtype=uint8)
[12]:

2. Wrapping Matplotlib’s AxesPlot or Seaborn Plot
You can use tfplot.autowrap (or raw APIs such as tfplot.plot, etc.) to plot anything by writing a customized plotting function on your own, but sometimes we may want to convert already existing plot functions from common libraries such as matplotlib and seaborn.
To do this, you can still use tfplot.autowrap.
Matplotlib
Matplotlib provides a variety of plot methods defined in the class AxesPlot (usually, ax).
[13]:
rs = np.random.RandomState(42)
x = rs.randn(100)
y = 2 * x + rs.randn(100)
fig, ax = plt.subplots()
ax.scatter(x, y)
ax.set_title("Created from matplotlib API")
plt.show()

We can wrap the Axes.scatter() method as TensorFlow op as follows:
[14]:
from matplotlib.axes import Axes
tf_scatter = tfplot.autowrap(Axes.scatter, figsize=(4, 4))
plot_op = tf_scatter(x, y)
execute_op_as_image(plot_op)
Executing: Tensor("scatter:0", shape=(?, ?, 4), dtype=uint8)
[14]:

Seaborn
Seaborn provides many useful axis plot functions that can be used out-of-box. Most of functions for drawing an AxesPlot will have the ax=... parameter.
See seaborn’s example gallery for interesting features seaborn provides.
[15]:
import seaborn as sns
assert sns.__version__ >= '0.8', \
'Use seaborn >= v0.8.0, otherwise `import seaborn as sns` will affect the default matplotlib style.'
barplot: (Discrete) Probability Distribution
[16]:
# https://seaborn.pydata.org/generated/seaborn.barplot.html
y = np.random.RandomState(42).normal(size=[18])
y = np.exp(y) / np.exp(y).sum() # softmax
y = tf.constant(y, dtype=tf.float32)
ATARI_ACTIONS = [
'⠀', '●', '↑', '→', '←', '↓', '↗', '↖', '↘', '↙',
'⇑', '⇒', '⇐', '⇓', '⇗', '⇖', '⇘', '⇙' ]
x = tf.constant(ATARI_ACTIONS)
op = tfplot.autowrap(sns.barplot, palette='Blues_d')(x, y)
execute_op_as_image(op)
Executing: Tensor("barplot:0", shape=(?, ?, 4), dtype=uint8)
[16]:

[17]:
y = np.random.RandomState(42).normal(size=[3, 18])
y = np.exp(y) / np.exp(y).sum(axis=1).reshape([-1, 1]) # softmax example-wise
y = tf.constant(y, dtype=tf.float32)
ATARI_ACTIONS = [
'⠀', '●', '↑', '→', '←', '↓', '↗', '↖', '↘', '↙',
'⇑', '⇒', '⇐', '⇓', '⇗', '⇖', '⇘', '⇙' ]
x = tf.broadcast_to(tf.constant(ATARI_ACTIONS), y.shape)
op = tfplot.autowrap(sns.barplot, palette='Blues_d', batch=True)(x, y)
for im in execute_op_as_image(op):
display(im)
Executing: Tensor("barplot_1/PlotImages:0", shape=(3, ?, ?, 4), dtype=uint8)


Heatmap
Let’s wrap seaborn’s heatmap function, as TensorFlow operation, with some additional default kwargs. This is very useful for visualization.
[18]:
# @seealso https://seaborn.pydata.org/examples/heatmap_annotation.html
tf_heatmap = tfplot.autowrap(sns.heatmap, figsize=(9, 6))
op = tf_heatmap(attention_map, cbar=True, annot=True, fmt=".2f")
execute_op_as_image(op)
Executing: Tensor("heatmap:0", shape=(?, ?, 4), dtype=uint8)
[18]:

What if we don’t want axes and colorbars, but only the map itself? Compare to plain tf.summary.image, which just gives a grayscale image.
[19]:
# print only heatmap figures other than axis, colorbar, etc.
tf_heatmap = tfplot.autowrap(sns.heatmap, figsize=(4, 4), tight_layout=True,
cmap='jet', cbar=False, xticklabels=False, yticklabels=False)
op = tf_heatmap(attention_map, name='HeatmapImage')
execute_op_as_image(op)
Executing: Tensor("HeatmapImage:0", shape=(?, ?, 4), dtype=uint8)
[19]:

And Many More!
This document has covered a basic usage of tfplot, but there are a few more:
tfplot.contrib: contains some off-the-shelf functions for creating plot operations that can be useful in practice, in few lines (without a hassle of writing function body). See [contrib.ipynb] for more tour of available APIs.tfplot.plot(),tfplot.plot_many(), etc.: Low-level APIs.tfplot.summary: One-liner APIs for creating TF summary operations.
[21]:
import tfplot.contrib
For example, probmap and probmap_simple create an image Tensor that visualizes a probability map:
[22]:
op = tfplot.contrib.probmap(attention_map, figsize=(4, 3))
execute_op_as_image(op)
Executing: Tensor("probmap:0", shape=(?, ?, 4), dtype=uint8)
[22]:

[23]:
op = tfplot.contrib.probmap_simple(attention_map, figsize=(3, 3), vmin=0, vmax=1)
execute_op_as_image(op)
Executing: Tensor("probmap_1:0", shape=(?, ?, 4), dtype=uint8)
[23]:

That’s all! Please take a look at API documentations and more examples if you are interested.
tfplot.contrib: Some pre-defined plot ops
The tfplot.contrib package contains some off-the-shelf functions for defining plotting operations. This package provides some off-the-shelf functions that could be useful widely across many typical use cases.
Unfortunately, it may not provide super flexible and fine-grained customization points beyond the current parameters. If it does not fit what you want to get, then consider designing your own plotting functions using tfplot.autowrap.
[6]:
import tfplot.contrib
for fn in sorted(tfplot.contrib.__all__):
print("%-20s" % fn, tfplot.contrib.__dict__[fn].__doc__.split('\n')[1].strip())
batch Make an autowrapped plot function (... -> RGBA tf.Tensor) work in a batch
probmap Display a heatmap in color. The resulting op will be a RGBA image Tensor.
probmap_simple Display a heatmap in color, but only displays the image content.
probmap
For example, probmap and probmap_simple create an image Tensor that visualizes a probability map:
[7]:
attention_op = tf.constant(attention_map, name="attention_op")
print(attention_op)
op = tfplot.contrib.probmap(attention_map, figsize=(4, 3))
execute_op_as_image(op)
Tensor("attention_op:0", shape=(16, 16), dtype=float32)
Executing: Tensor("probmap:0", shape=(?, ?, 4), dtype=uint8)
[7]:

[8]:
op = tfplot.contrib.probmap_simple(attention_map, figsize=(3, 3),
vmin=0, vmax=1)
execute_op_as_image(op)
Executing: Tensor("probmap_1:0", shape=(?, ?, 4), dtype=uint8)
[8]:

Auto-batch mode (tfplot.contrib.batch)
In many cases, we may want to make plotting operations behave in a batch manner. You can use tfplot.contrib.batch to make those functions work in a batch mode:
[9]:
# batch version
N = 5
p = np.zeros([N, N, N])
for i in range(N):
p[i, i, i] = 1.0
p = tf.constant(p, name="batch_tensor"); print(p) # (batch_size, 5, 5)
op = tfplot.contrib.batch(tfplot.contrib.probmap)(p, figsize=(3, 2)) # (batch_size, H, W, 4)
results = execute_op_as_image(op) # list of N images
Image.fromarray(np.hstack([np.asarray(im) for im in results]))
Tensor("batch_tensor:0", shape=(5, 5, 5), dtype=float64)
Executing: Tensor("probmap_2/PlotImages:0", shape=(5, ?, ?, 4), dtype=uint8)
[9]:

More APIs
Low-level APIs: tfplot.plot()
The following examples show the usage of the most general form of the API, tfplot.plot(). It has a very similar usage as tf.py_func().
Conceptually, we can draw any matplotlib plot as a TensorFlow op. One thing to remember is that the plot_func function (passed to tfplot.plot()) should be implemented using object-oriented APIs of matplotlib, not pyplot.XXX APIs (or matplotlib.pyplot.XXX) in order to avoid thread-safety issues.
A basic example
[25]:
def test_figure():
fig, ax = tfplot.subplots(figsize=(3, 3))
ax.text(0.5, 0.5, "Hello World!",
ha='center', va='center', size=24)
return fig
plot_op = tfplot.plot(test_figure, [])
execute_op_as_image(plot_op)
Executing: Tensor("Plot:0", shape=(?, ?, 4), dtype=uint8)
[25]:

with Arguments
[26]:
def figure_attention(attention):
fig, ax = tfplot.subplots(figsize=(4, 3))
im = ax.imshow(attention, cmap='jet')
fig.colorbar(im)
return fig
plot_op = tfplot.plot(figure_attention, [attention_tensor])
execute_op_as_image(plot_op)
Executing: Tensor("Plot_1:0", shape=(?, ?, 4), dtype=uint8)
[26]:

Examples of using kwargs
[27]:
# the plot function can have additional kwargs for providing configuration points
def overlay_attention(attention, image,
alpha=0.5, cmap='jet'):
fig = tfplot.Figure(figsize=(4, 4))
ax = fig.add_subplot(1, 1, 1)
ax.axis('off')
fig.subplots_adjust(0, 0, 1, 1) # get rid of margins
H, W = attention.shape
ax.imshow(image, extent=[0, H, 0, W])
ax.imshow(attention, cmap=cmap,
alpha=alpha, extent=[0, H, 0, W])
return fig
[28]:
plot_op = tfplot.plot(overlay_attention, [attention_tensor, image_tensor])
execute_op_as_image(plot_op)
Executing: Tensor("Plot_2:0", shape=(?, ?, 4), dtype=uint8)
[28]:

[29]:
# the kwargs to `tfplot.plot()` are passed to the plot function (i.e. `overlay_attention`)
# during the execution of the plot operation.
plot_op = tfplot.plot(overlay_attention, [attention_tensor, image_tensor],
cmap='gray', alpha=0.8)
execute_op_as_image(plot_op)
Executing: Tensor("Plot_3:0", shape=(?, ?, 4), dtype=uint8)
[29]:

plot_many() – the batch version
[30]:
# make a fake batch
batch_size = 3
attention_batch = tf.random_gamma([batch_size, 7, 7], alpha=0.3, seed=42)
image_batch = tf.tile(tf.expand_dims(image_tensor, 0),
[batch_size, 1, 1, 1], name='image_batch')
print (attention_batch)
print (image_batch)
# plot_many()
plot_op = tfplot.plot_many(overlay_attention, [attention_batch, image_batch])
images = execute_op_as_image(plot_op)
Tensor("random_gamma/Maximum:0", shape=(3, 7, 7), dtype=float32)
Tensor("image_batch:0", shape=(3, 768, 1024, 3), dtype=uint8)
Executing: Tensor("PlotMany/PlotImages:0", shape=(3, ?, ?, 4), dtype=uint8)
[31]:
# just see the three images
_, axes = plt.subplots(1, 3, figsize=(10, 3))
for i in range(3):
axes[i].set_title("%d : [%dx%d]" % (i, images[i].height, images[i].width))
axes[i].imshow(images[i])
plt.show()

Wrap once, use it as a factory – tfplot.autowrap() or tfplot.wrap()
Let’s wrap the function overlay_attention, which
- takes a heatmap
attentionand a RGB imageoverlay_image - and plots the heatmap on top of the image
as Tensors:
[32]:
plot_op = tfplot.autowrap(overlay_attention)(attention_tensor, image_tensor)
execute_op_as_image(plot_op)
Executing: Tensor("overlay_attention:0", shape=(?, ?, 4), dtype=uint8)
[32]:

More clean style in a functional way!
Batch example
[33]:
tf_plot_attention = tfplot.wrap(overlay_attention, name='PlotAttention', batch=True)
print (tf_plot_attention)
<function wrap[__main__.overlay_attention] at 0x127f26f28>
Then we can call the resulting tf_plot_attention function to build new TensorFlow ops:
[34]:
plot_op = tf_plot_attention(attention_batch, image_batch)
images = execute_op_as_image(plot_op)
images
Executing: Tensor("PlotAttention/PlotImages:0", shape=(3, ?, ?, 4), dtype=uint8)
[34]:
[<PIL.Image.Image image mode=RGBA size=288x288 at 0x12A896470>,
<PIL.Image.Image image mode=RGBA size=288x288 at 0x12A896390>,
<PIL.Image.Image image mode=RGBA size=288x288 at 0x12A8962E8>]
[35]:
# just see the three images
_, axes = plt.subplots(1, 3, figsize=(10, 3))
for i in range(3):
axes[i].set_title("%d : [%dx%d]" % (i, images[i].height, images[i].width))
axes[i].imshow(images[i])
plt.show()

tfplot.summary (deprecated)
Finally, we can directly create a TensorFlow summary op from input tensors. This will give a similar API usage as tf.summary.image(), which is a shortcut to creating plot ops and then creating image summaries.
[36]:
import tfplot.summary
tfplot.summary.plot()
[37]:
# Just directly add a single plot result into a summary
summary_op = tfplot.summary.plot("plot_summary", test_figure, [])
print(summary_op)
execute_op_as_image(summary_op)
Tensor("plot_summary/ImageSummary:0", shape=(), dtype=string)
Executing: Tensor("plot_summary/ImageSummary:0", shape=(), dtype=string)
[37]:

tfplot.summary.plot_many() – the batch version
[38]:
# batch of attention maps --> image summary
batch_size, H, W = 4, 4, 4
batch_attentions = np.zeros((batch_size, H, W), dtype=np.float32)
for b in range(batch_size):
batch_attentions[b, b, b] = 1.0
# Note that tfplot.summary.plot_many() takes an input in a batch form
def figure_attention_demo2(attention):
fig, ax = tfplot.subplots(figsize=(4, 3))
im = ax.imshow(attention, cmap='jet')
fig.colorbar(im)
return fig
summary_op = tfplot.summary.plot_many("batch_attentions_summary", figure_attention_demo2,
[batch_attentions], max_outputs=4)
print(summary_op)
images = execute_op_as_image(summary_op)
Tensor("batch_attentions_summary/ImageSummary:0", shape=(), dtype=string)
Executing: Tensor("batch_attentions_summary/ImageSummary:0", shape=(), dtype=string)
[39]:
# just see the 4 images in the summary
_, axes = plt.subplots(2, 2, figsize=(8, 6))
for i in range(batch_size):
axes[i//2, i%2].set_title("%d : [%dx%d]" % (i, images[i].height, images[i].width))
axes[i//2, i%2].imshow(images[i])
plt.show()

API References
tfplot
Wrapper functions
-
tfplot.autowrap(*args, **kwargs)[source]¶ Wrap a function as a TensorFlow operation similar to
tfplot.wrap()(as a decorator or with normal function call), but provides with additional features such as auto-creating matplotlib figures.- (
fig,ax) matplotlib objects are automatically created and injected given that plot_func has a keyword argument namedfigand/or`ax. In such cases, we do not need to manually calltfplot.subplots()to create matplotlib figure/axes objects. If a manual creation offig, axis forced, please consider usingtfplot.wrap()instead. - It can automatically handle return values of the provided plot_func
function. If it returns nothing (None) but
figwas automatically injected then the resulting figure will be drawn, or returnsAxesthen the associatedFigurewill be used.
Example
>>> @tfplot.autowrap(figsize=(3, 3)) >>> def plot_imshow(img, *, fig, ax): >>> ax.imshow(img) >>> >>> plot_imshow(an_image_tensor) Tensor("plot_imshow:0", shape=(?, ?, 4), dtype=uint8)
Parameters: - plot_func – A python function or callable to wrap. See the documentation
of
tfplot.plot()for details. Additionally, if this function has a parameter namedfigand/orax, new instances ofFigureand/orAxesSubplotwill be created and passed. - batch – If True, all the tensors passed as argument will be assumed to be batched. Default value is False.
- name – A default name for the operation (optional). If not given, the
name of
plot_funcwill be used. - figsize – The figure size for the figure to be created.
- tight_layout – If True, the resulting figure will have no margins for
axis. Equivalent to calling
fig.subplots_adjust(0, 0, 1, 1). - kwargs_default – An optimal kwargs that will be passed by default to
plot_funcwhen executed inside a TensorFlow graph.
- (
-
tfplot.wrap(*args, **kwargs)[source]¶ Wrap a plot function as a TensorFlow operation. It will return a python function that creates a TensorFlow plot operation applying the arguments as input. It can be also used as a decorator.
For example:
>>> @tfplot.wrap >>> def plot_imshow(img): >>> fig, ax = tfplot.subplots() >>> ax.imshow(img) >>> return fig >>> >>> plot_imshow(an_image_tensor) Tensor("plot_imshow:0", shape=(?, ?, 4), dtype=uint8)
Or, if
plot_funcis a python function that takes numpy arrays as input and draw a plot by returning a matplotlib Figure, we can wrap this function as a Tensor factory, such as:>>> tf_plot = tfplot.wrap(plot_func, name="MyPlot", batch=True) >>> # x, y = get_batch_inputs(batch_size=4, ...) >>> plot_x = tf_plot(x) Tensor("MyPlot:0", shape=(4, ?, ?, 4), dtype=uint8) >>> plot_y = tf_plot(y) Tensor("MyPlot_1:0", shape=(4, ?, ?, 4), dtype=uint8)
Parameters: - plot_func – A python function or callable to wrap. See the documentation
of
tfplot.plot()for details. - batch – If True, all the tensors passed as argument will be assumed to be batched. Default value is False.
- name – A default name for the operation (optional). If not given, the
name of
plot_funcwill be used. - kwargs – An optional kwargs that will be passed by default to
plot_funcwhen executed inside a TensorFlow graph.
Returns: A python function that will create a TensorFlow plot operation, passing the provided arguments.
- plot_func – A python function or callable to wrap. See the documentation
of
-
tfplot.wrap_axesplot(axesplot_func, _sentinel=None, batch=False, name=None, figsize=None, tight_layout=False, **kwargs)[source]¶ DEPRECATED: Use
tfplot.autowrap()instead. Will be removed in the next version.Wrap an axesplot function as a TensorFlow operation. It will return a python function that creates a TensorFlow plot operation applying the arguments as input.
An axesplot function
axesplot_funccan be either:- an unbounded method of matplotlib Axes (or AxesSubplot) class,
such as
Axes.scatter()andAxes.text(), etc, or - a simple python function that takes the named argument
ax, of type Axes or AxesSubplot, on which the plot will be drawn. Some good examples of this family includesseaborn.heatmap(ax=...).
The resulting function can be used as a Tensor factory. When the created tensorflow plot op is being executed, a new matplotlib figure which consists of a single AxesSubplot will be created, and the axes plot will be used as an argument for
axesplot_func. For example,>>> import seaborn.apionly as sns >>> tf_heatmap = tfplot.wrap_axesplot(sns.heatmap, name="HeatmapPlot", figsize=(4, 4), cmap='jet')
>>> plot_op = tf_heatmap(attention_map, cmap) Tensor(HeatmapPlot:0", shape=(?, ?, 4), dtype=uint8)
Parameters: - axesplot_func – An unbounded method of matplotlib Axes or AxesSubplot, or a python function or callable which has the ax parameter for specifying the axis to draw on.
- batch – If True, all the tensors passed as argument will be assumed to be batched. Default value is False.
- name – A default name for the operation (optional). If not given, the
name of
axesplot_funcwill be used. - figsize – The figure size for the figure to be created.
- tight_layout – If True, the resulting figure will have no margins for
axis. Equivalent to calling
fig.subplots_adjust(0, 0, 1, 1). - kwargs – An optional kwargs that will be passed by default to
axesplot_func.
Returns: A python function that will create a TensorFlow plot operation, passing the provied arguments and a new instance of AxesSubplot into
axesplot_func.- an unbounded method of matplotlib Axes (or AxesSubplot) class,
such as
Raw Plot Ops
-
tfplot.plot(plot_func, in_tensors, name='Plot', **kwargs)[source]¶ Create a TensorFlow op which draws plot in an image. The resulting image is in a 3-D uint8 tensor.
Given a python function
plot_func, which takes numpy arrays as its inputs (the evaluations ofin_tensors) and returns a matplotlib Figure object as its outputs, wrap this function as a TensorFlow op. The returning figure will be rendered as a RGB-A image upon execution.Parameters: - plot_func – a python function or callable
The function which accepts numpy ndarray objects as an argument
that match the corresponding tf.Tensor objects in
in_tensors. It should return a new instance ofmatplotlib.figure.Figure, which contains the resulting plot image. - in_tensors – A list of tf.Tensor objects.
- name – A name for the operation (optional).
- kwargs – Additional keyword arguments passed to
plot_func(optional).
Returns: A single uint8 Tensor of shape
(?, ?, 4), containing the plot image thatplot_funccomputes.- plot_func – a python function or callable
The function which accepts numpy ndarray objects as an argument
that match the corresponding tf.Tensor objects in
-
tfplot.plot_many(plot_func, in_tensors, name='PlotMany', max_outputs=None, **kwargs)[source]¶ A batch version of
plot. Create a TensorFlow op which draws a plot for each image. The resulting images are given in a 4-D uint8 Tensor of shape[batch_size, height, width, 4].Parameters: - plot_func – A python function or callable, which accepts numpy
ndarray objects as an argument that match the corresponding
tf.Tensor objects in
in_tensors. It should return a new instance ofmatplotlib.figure.Figure, which contains the resulting plot image. The shape (height, width) of generated figure for each plot should be same. - in_tensors – A list of tf.Tensor objects.
- name – A name for the operation (optional).
- max_outputs – Max number of batch elements to generate plots for (optional).
- kwargs – Additional keyword arguments passed to plot_func (optional).
Returns: A single uint8 Tensor of shape
(B, ?, ?, 4), containing the B plot images, each of which is computed byplot_func, where B equalsbatch_size, the number of batch elements in the each tensor fromin_tensors, ormax_outputs(whichever is smaller).- plot_func – A python function or callable, which accepts numpy
ndarray objects as an argument that match the corresponding
tf.Tensor objects in
tfplot.figure
Figure utilities.
-
tfplot.figure.to_array(fig)[source]¶ Convert a matplotlib figure
figinto a 3D numpy array.Example
>>> fig, ax = tfplot.subplots(figsize=(4, 4)) >>> # draw whatever, e.g. ax.text(0.5, 0.5, "text")
>>> im = to_array(fig) # ndarray [288, 288, 4]
Parameters: fig – A matplotlib.figure.Figureobject.Returns: A numpy ndarrayof shape(?, ?, 4), containing an RGB-A image of the figure.
-
tfplot.figure.to_summary(fig, tag)[source]¶ Convert a matplotlib figure
figinto a TensorFlow Summary object that can be directly fed intoSummary.FileWriter.Example
>>> fig, ax = ... # (as above) >>> summary = to_summary(fig, tag='MyFigure/image')
>>> type(summary) tensorflow.core.framework.summary_pb2.Summary >>> summary_writer.add_summary(summary, global_step=global_step)
Parameters: - fig – A
matplotlib.figure.Figureobject. - tag (string) – The tag name of the created summary.
Returns: A TensorFlow
Summaryprotobuf object containing the plot image as a image summary.- fig – A
-
tfplot.figure.subplots(nrows=1, ncols=1, sharex=False, sharey=False, squeeze=True, subplot_kw=None, gridspec_kw=None, **fig_kw)[source]¶ Create a figure and a set of subplots, as in pyplot.subplots().
It works almost similar to pyplot.subplots(), but differ from it in that it does not involve any side effect as pyplot does (e.g. modifying thread states such as current figure or current subplot).
(docstrings inherited from matplotlib.pyplot.subplots)
Parameters: - ncols (nrows,) – Number of rows/columns of the subplot grid.
- sharey (sharex,) –
Controls sharing of properties among x (sharex) or y (sharey) axes:
- True or ‘all’: x- or y-axis will be shared among all subplots.
- False or ‘none’: each subplot x- or y-axis will be independent.
- ’row’: each subplot row will share an x- or y-axis.
- ’col’: each subplot column will share an x- or y-axis.
When subplots have a shared x-axis along a column, only the x tick labels of the bottom subplot are created. Similarly, when subplots have a shared y-axis along a row, only the y tick labels of the first column subplot are created. To later turn other subplots’ ticklabels on, use
tick_params(). - squeeze (bool, optional, default: True) –
- If True, extra dimensions are squeezed out from the returned
array of Axes:
- if only one subplot is constructed (nrows=ncols=1), the resulting single Axes object is returned as a scalar.
- for Nx1 or 1xM subplots, the returned object is a 1D numpy object array of Axes objects.
- for NxM, subplots with N>1 and M>1 are returned as a 2D array.
- If False, no squeezing at all is done: the returned Axes object is always a 2D array containing Axes instances, even if it ends up being 1x1.
- If True, extra dimensions are squeezed out from the returned
array of Axes:
- subplot_kw (dict, optional) – Dict with keywords passed to the
add_subplot()call used to create each subplot. - gridspec_kw (dict, optional) – Dict with keywords passed to the
GridSpecconstructor used to create the grid the subplots are placed on. - **fig_kw – All additional keyword arguments are passed to the
figure()call.
Returns: - fig (
matplotlib.figure.Figureobject) - ax (Axes object or array of Axes objects.) – ax can be either a single
matplotlib.axes.Axesobject or an array of Axes objects if more than one subplot was created. The dimensions of the resulting array can be controlled with the squeeze keyword, see above.
Examples
First create some toy data:
>>> x = np.linspace(0, 2*np.pi, 400) >>> y = np.sin(x**2)
Creates just a figure and only one subplot
>>> fig, ax = tfplot.subplots() >>> ax.plot(x, y) >>> ax.set_title('Simple plot')
Creates two subplots and unpacks the output array immediately
>>> f, (ax1, ax2) = tfplot.subplots(1, 2, sharey=True) >>> ax1.plot(x, y) >>> ax1.set_title('Sharing Y axis') >>> ax2.scatter(x, y)
Creates four polar axes, and accesses them through the returned array
>>> fig, axes = tfplot.subplots(2, 2, subplot_kw=dict(polar=True)) >>> axes[0, 0].plot(x, y) >>> axes[1, 1].scatter(x, y)
Share a X axis with each column of subplots
>>> tfplot.subplots(2, 2, sharex='col')
Share a Y axis with each row of subplots
>>> tfplot.subplots(2, 2, sharey='row')
Share both X and Y axes with all subplots
>>> tfplot.subplots(2, 2, sharex='all', sharey='all')
Note that this is the same as
>>> tfplot.subplots(2, 2, sharex=True, sharey=True)
See also
figure(),subplot()
tfplot.contrib
Some predefined plot functions.
-
tfplot.contrib.probmap(*args, **kwargs_call)[source]¶ Display a heatmap in color. The resulting op will be a RGBA image Tensor.
Parameters: - x – A 2-D image-like tensor to draw.
- cmap – Matplotlib colormap. Defaults ‘jet’
- axis – If True (default), x-axis and y-axis will appear.
- colorbar – If True (default), a colorbar will be placed on the right.
- vmin – A scalar. Minimum value of the range. See
matplotlib.axes.Axes.imshow. - vmax – A scalar. Maximum value of the range. See
matplotlib.axes.Axes.imshow.
Returns: A uint8 Tensor of shape
(?, ?, 4)containing the resulting plot.
-
tfplot.contrib.probmap_simple(x, **kwargs)[source]¶ Display a heatmap in color, but only displays the image content. The resulting op will be a RGBA image Tensor.
It reduces to
probmaphaving colorbar and axis off. See the documentation ofprobmapfor available arguments.
-
tfplot.contrib.batch(func)[source]¶ Make an autowrapped plot function (… -> RGBA tf.Tensor) work in a batch manner.
Example
>>> p Tensor("p:0", shape=(batch_size, 16, 16, 4), dtype=uint8) >>> tfplot.contrib.batch(tfplot.contrib.probmap)(p) Tensor("probmap/PlotImages:0", shape=(batch_size, ?, ?, 4), dtype=uint8)
tfplot.summary
Summary Op utilities.
-
tfplot.summary.wrap(plot_func, _sentinel=None, batch=False, name=None, **kwargs)[source]¶ Wrap a plot function as a TensorFlow summary builder. It will return a python function that creates a TensorFlow op which evaluates to
Summaryprotocol buffer with image.The resulting function (say
summary_wrapped) will have the following signature:summary_wrapped(name, tensor, # [more input tensors ...], max_outputs=3, collections=None)
Examples
Given a plot function which returns a matplotlib Figure,
>>> def figure_heatmap(data, cmap='jet'): >>> fig, ax = tfplot.subplots() >>> ax.imshow(data, cmap=cmap) >>> return fig
we can wrap it as a summary builder function:
>>> summary_heatmap = tfplot.summary.wrap(figure_heatmap, batch=True)
Now, when building your computation graph, call it to build summary ops like
tf.summary.image:>>> heatmap_tensor <tf.Tensor 'heatmap_tensor:0' shape=(16, 128, 128) dtype=float32> >>> >>> summary_heatmap("heatmap/original", heatmap_tensor) >>> summary_heatmap("heatmap/cmap_gray", heatmap_tensor, cmap=gray) >>> summary_heatmap("heatmap/no_default_collections", heatmap_tensor, collections=[])
Parameters: - plot_func – A python function or callable to wrap. See the documentation
of
tfplot.plot()for details. - batch – If True, all the tensors passed as argument will be assumed to be batched. Default value is False.
- name – A default name for the plot op (optional). If not given, the
name of
plot_funcwill be used. - kwargs – Optional keyword arguments that will be passed by default to
plot().
Returns: A python function that will create a TensorFlow summary operation, passing the provided arguments into plot op.
- plot_func – A python function or callable to wrap. See the documentation
of
-
tfplot.summary.plot(name, plot_func, in_tensors, collections=None, **kwargs)[source]¶ Create a TensorFlow op that outpus a Summary protocol buffer, to which a single plot operation is executed (i.e. image summary).
Basically, it is a one-liner wrapper of
tfplot.ops.plot()andtf.summary.image()calls.The generated Summary object contains single image summary value of the image of the plot drawn.
Parameters: - name – The name of scope for the generated ops and the summary op. Will also serve as a series name prefix in TensorBoard.
- plot_func – A python function or callable, specifying the plot operation
as in
tfplot.plot(). See the documentation attfplot.plot(). - in_tensors – A list of Tensor objects, as in
plot(). - collections – Optional list of
ops.GraphKeys. The collections to add the summary to. Defaults to[_ops.GraphKeys.SUMMARIES]. - kwargs – Optional keyword arguments passed to
plot().
Returns: A scalar Tensor of type string. The serialized Summary protocol buffer (tensorflow operation).
-
tfplot.summary.plot_many(name, plot_func, in_tensors, max_outputs=3, collections=None, **kwargs)[source]¶ Create a TensorFlow op that outputs a Summary protocol buffer, where plots could be drawn in a batch manner. This is a batch version of
tfplot.summary.plot().Specifically, all the input tensors
in_tensorstoplot_funcis assumed to have the same batch size. Tensors corresponding to a single batch element will be passed toplot_funcas input.The resulting Summary contains multiple (up to
max_outputs) image summary values, each of which contains a plot rendered byplot_func.Parameters: - name – The name of scope for the generated ops and the summary op. Will also serve as a series name prefix in TensorBoard.
- plot_func – A python function or callable, specifying the plot operation
as in
tfplot.plot(). See the documentation attfplot.plot(). - in_tensors – A list of Tensor objects, the input to
plot_funcbut each in a batch. - max_outputs – Max number of batch elements to generate plots for.
- collections – Optional list of
ops.GraphKeys. The collections to add the sumamry to. Defaults to[_ops.GraphKeys.SUMMARIES]. - kwargs – Optional keyword arguments passed to
plot().
Returns: A scalar Tensor of type string. The serialized Summary protocol buffer (tensorflow operation).