Django Chartflo
To install: pip install django-chartflo
Add to INSTALLED_APPS:
"vv",
"chartflo",
Add to settings:
VV_APPS = ["chartflo"]
Add to urls:
url(r'^dashboards/',include('chartflo.urls')),
Run the migrations.
Overview
Steps to get a dashboard:
- Generate charts
- Create a dashboard with views (no python code to write)
- Create templates for the dashboard views
- Create a data pipeline to update the dashboard’s charts and widgets
Usage
The dashboards use pre-generated html charts loaded as templates. The charts generation is handled by the Dataswim library, but anything that produces html can be used.
A demo project is available for a complete example
Let’s make a simple timeseries module with a dashboard as an example.
Create a model
This step is optional: charts can be produced without a model
Model (uses Django Pandas):
from django.db import models
from django.utils.translation import ugettext_lazy as _
from django_pandas.managers import DataFrameManager
class Serie(models.Model):
date = models.DateField(verbose_name=_("Date"))
value = models.FloatField(verbose_name=_("Value"))
objects = DataFrameManager()
class Meta:
ordering = ("-date",)
verbose_name = _("Serie")
verbose_name_plural = _("Series")
Create charts
Charts creation code in pipeline.py, in a notebook or anywhere. Example for a simple timeline:
from dataswim import ds
from .models import Serie
query = Serie.objects.all()
# convert the Django query to a Pandas dataframe
ds.df = query.to_dataframe()
# set what fields to chart
ds.chart("date", "value")
# generate the chart
c = ds.line_()
# store the chart for later saving
ds.stack("timeline", c)
# set the path where to save it
ds.report_path = "templates/dashboards/timeseries/charts"
# save the chart as html file
ds.to_files()
This will save a templates/dashboards/timeseries/charts/timeline.html html chart
Create a dashboard
Create a dashboard in the admin with the slug timeseries. Create an inline view for the dashboard and
set it active.
Create templates for the dashboard views
Create a template in templates/dashboards/timeseries/views/myview_slug.html with the view slug as filename:
{% include "templates/dashboards/timeseries/charts/timeline.html" %}
Go to /dashboards/timeseries/ to see the result
Single numbers
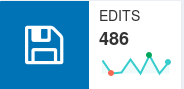
A widget showing a single number is available to include in a dashboard. It can optionaly embed a sparkline.
Simple
from chartflo.widgets.number import Number
n = Number()
html = n.simple(3, "Number label", icon="long-arrow-alt-up")
n.write("number_slug" , "dashboard_slug", html)
This will save a dashboards/dashboard_slug/numbers/number_slug.html file to include in a dashboard view. Icon
is a Font-awesome icon name.
With sparkline
from chartflo.widgets.number import Number
n = Number()
html = n.simple(3, "Number label", spdata=[1,2,1,3})
n.write("number_slug" , "dashboard_slug", html)
Sparklines
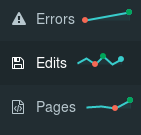
A sparkline with a limited number of datapoints.
from chartflo.widgets.sparkline import Sparrkline
sp = Sparkline()
html = sp.simple([1,2,2,4,1])
Datables
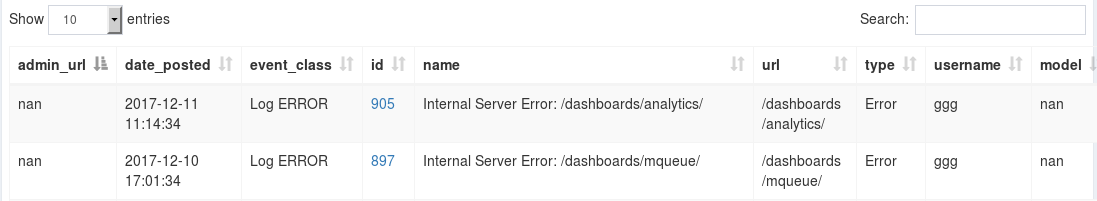
A widget showing tabular data.
from chartflo.widgets.datatable import DataTable
dt = DataTable()
# from a dataframe
dt.create("datatable_slug", "dashboard_slug", df=df, search=False)
# or from a query
dt.create("datatable_slug", "dashboard_slug", query=some_django_query)
This will save a dashboards/dashboard_slug/datatables/datatable_slug.html file to include in a dashboard view.
\ Sort by:\ best rated\ newest\ oldest\
\\
Add a comment\ (markup):
\``code``, \ code blocks:::and an indented block after blank line